앵귤러 디버그 하기
vs code로 프로젝트 열기
프로젝트 폴더를 visual studio code로 열자.
plugin 설치
Debugger for Chrome 플러그인을 설치한다.
https://marketplace.visualstudio.com/items?itemName=msjsdiag.debugger-for-chrome
디버그 에서 세팅을 하자.
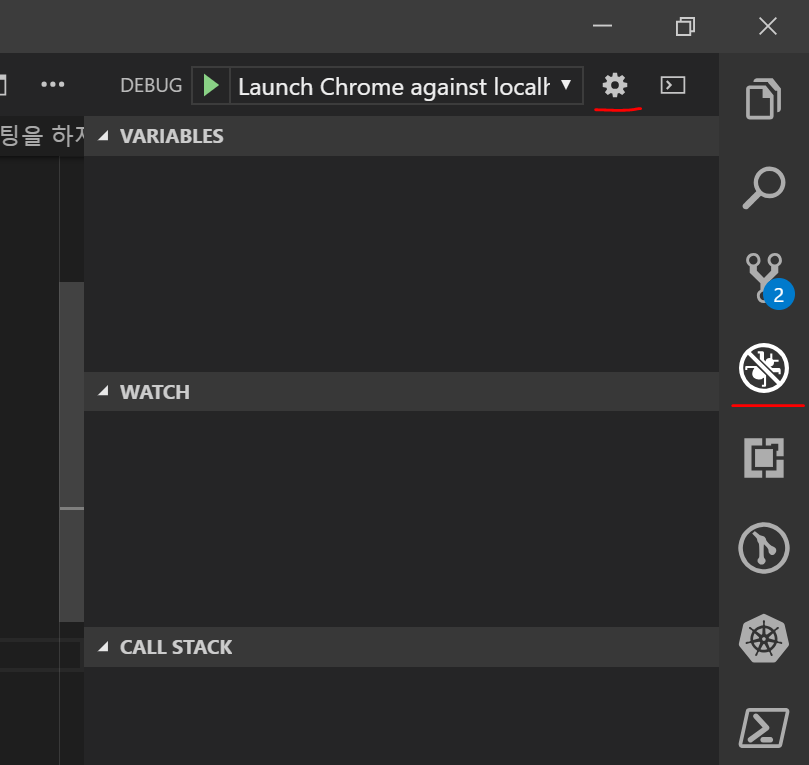
옵션 버튼을 누르면 화면이 열리는데 다음처럼 세팅하자.
{
  // Use IntelliSense to learn about possible attributes.
  // Hover to view descriptions of existing attributes.
  // For more information, visit: https://go.microsoft.com/fwlink/?linkid=830387
  "version": "0.2.0",
  "configurations": [
    {
      "type": "chrome",
      "request": "launch",
      "name": "Launch Chrome against localhost",
      "url": "http://localhost:4200",
      "webRoot": "${workspaceFolder}",
      "disableNetworkCache": true,
      "skipFiles": [
        "node_modules/*",
      ],
      "pathMapping": {
        "src": "${workspaceFolder}/src"
      }
    }
  ]
}
설정 파일을 저장하고 code를 재시작한다.
다시 프로젝트를 오픈하고 debug로 가면 조금전 세팅해둔 디버거 에이전트가 보인다.
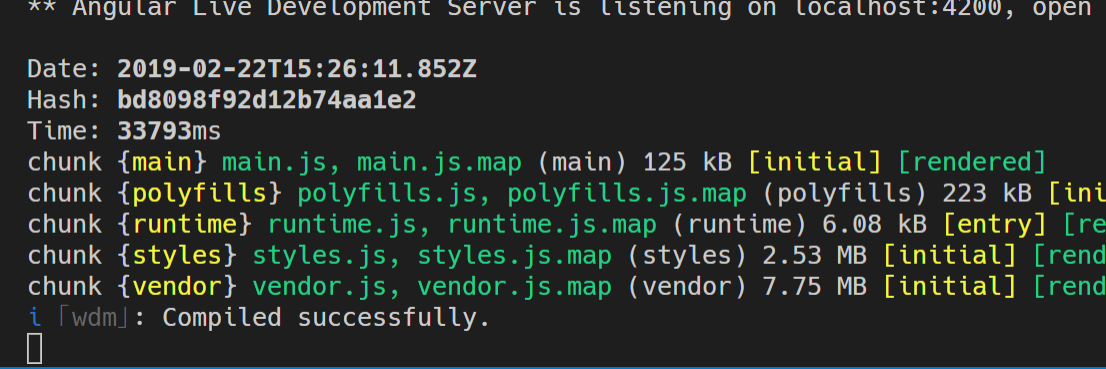
프로젝트 실행
터미널에서 프로젝트를 시작한다.
ng serve
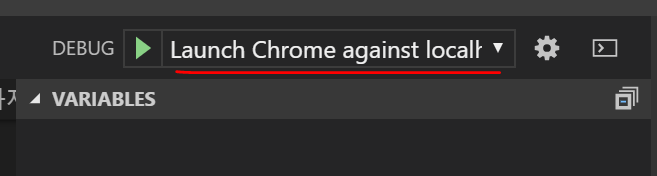
디버거를 실행
이제 디버거에 파란색 버튼을 누른다.
웹브라우저가 뜨면서 프로젝트가 보인다.
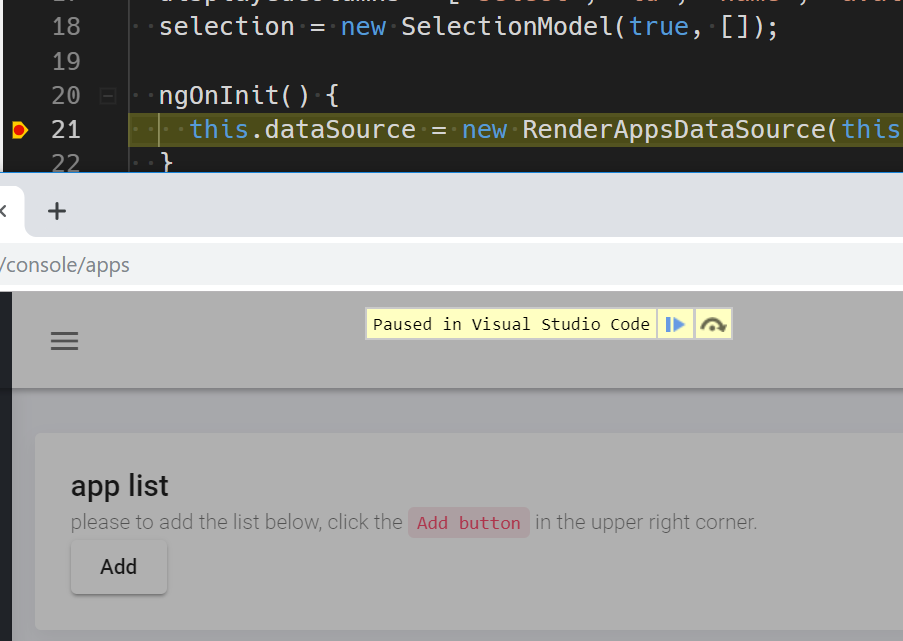
break point 설정
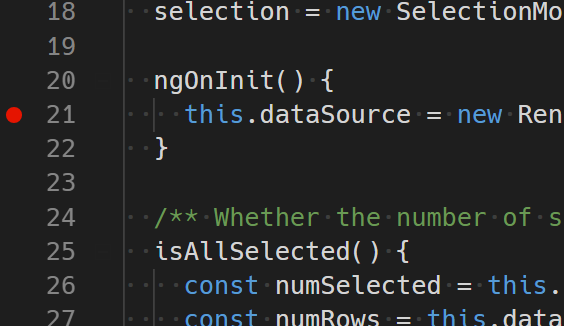
원하는 곳에 브레이크 포인트를 설정한다.
이제 앱을 실행시키면 그곳에서 디버깅이 걸리면서 값들을 확인할수 있다.
아주 편하다.
기타 크롬 디버깅도 알아두면 좋을듯
https://developers.google.com/web/tools/chrome-devtools/javascript/?hl=ko
이제 no more console.log….