Percona Monitoring and Management
Percona XtraDb Cluster를 사용하려면 모니터링을 붙여야한다. 이걸 해주는 녀석이다. 여러가지 오픈소스를 가지고 잘 역어서 사용하기 편하게 해주었다.
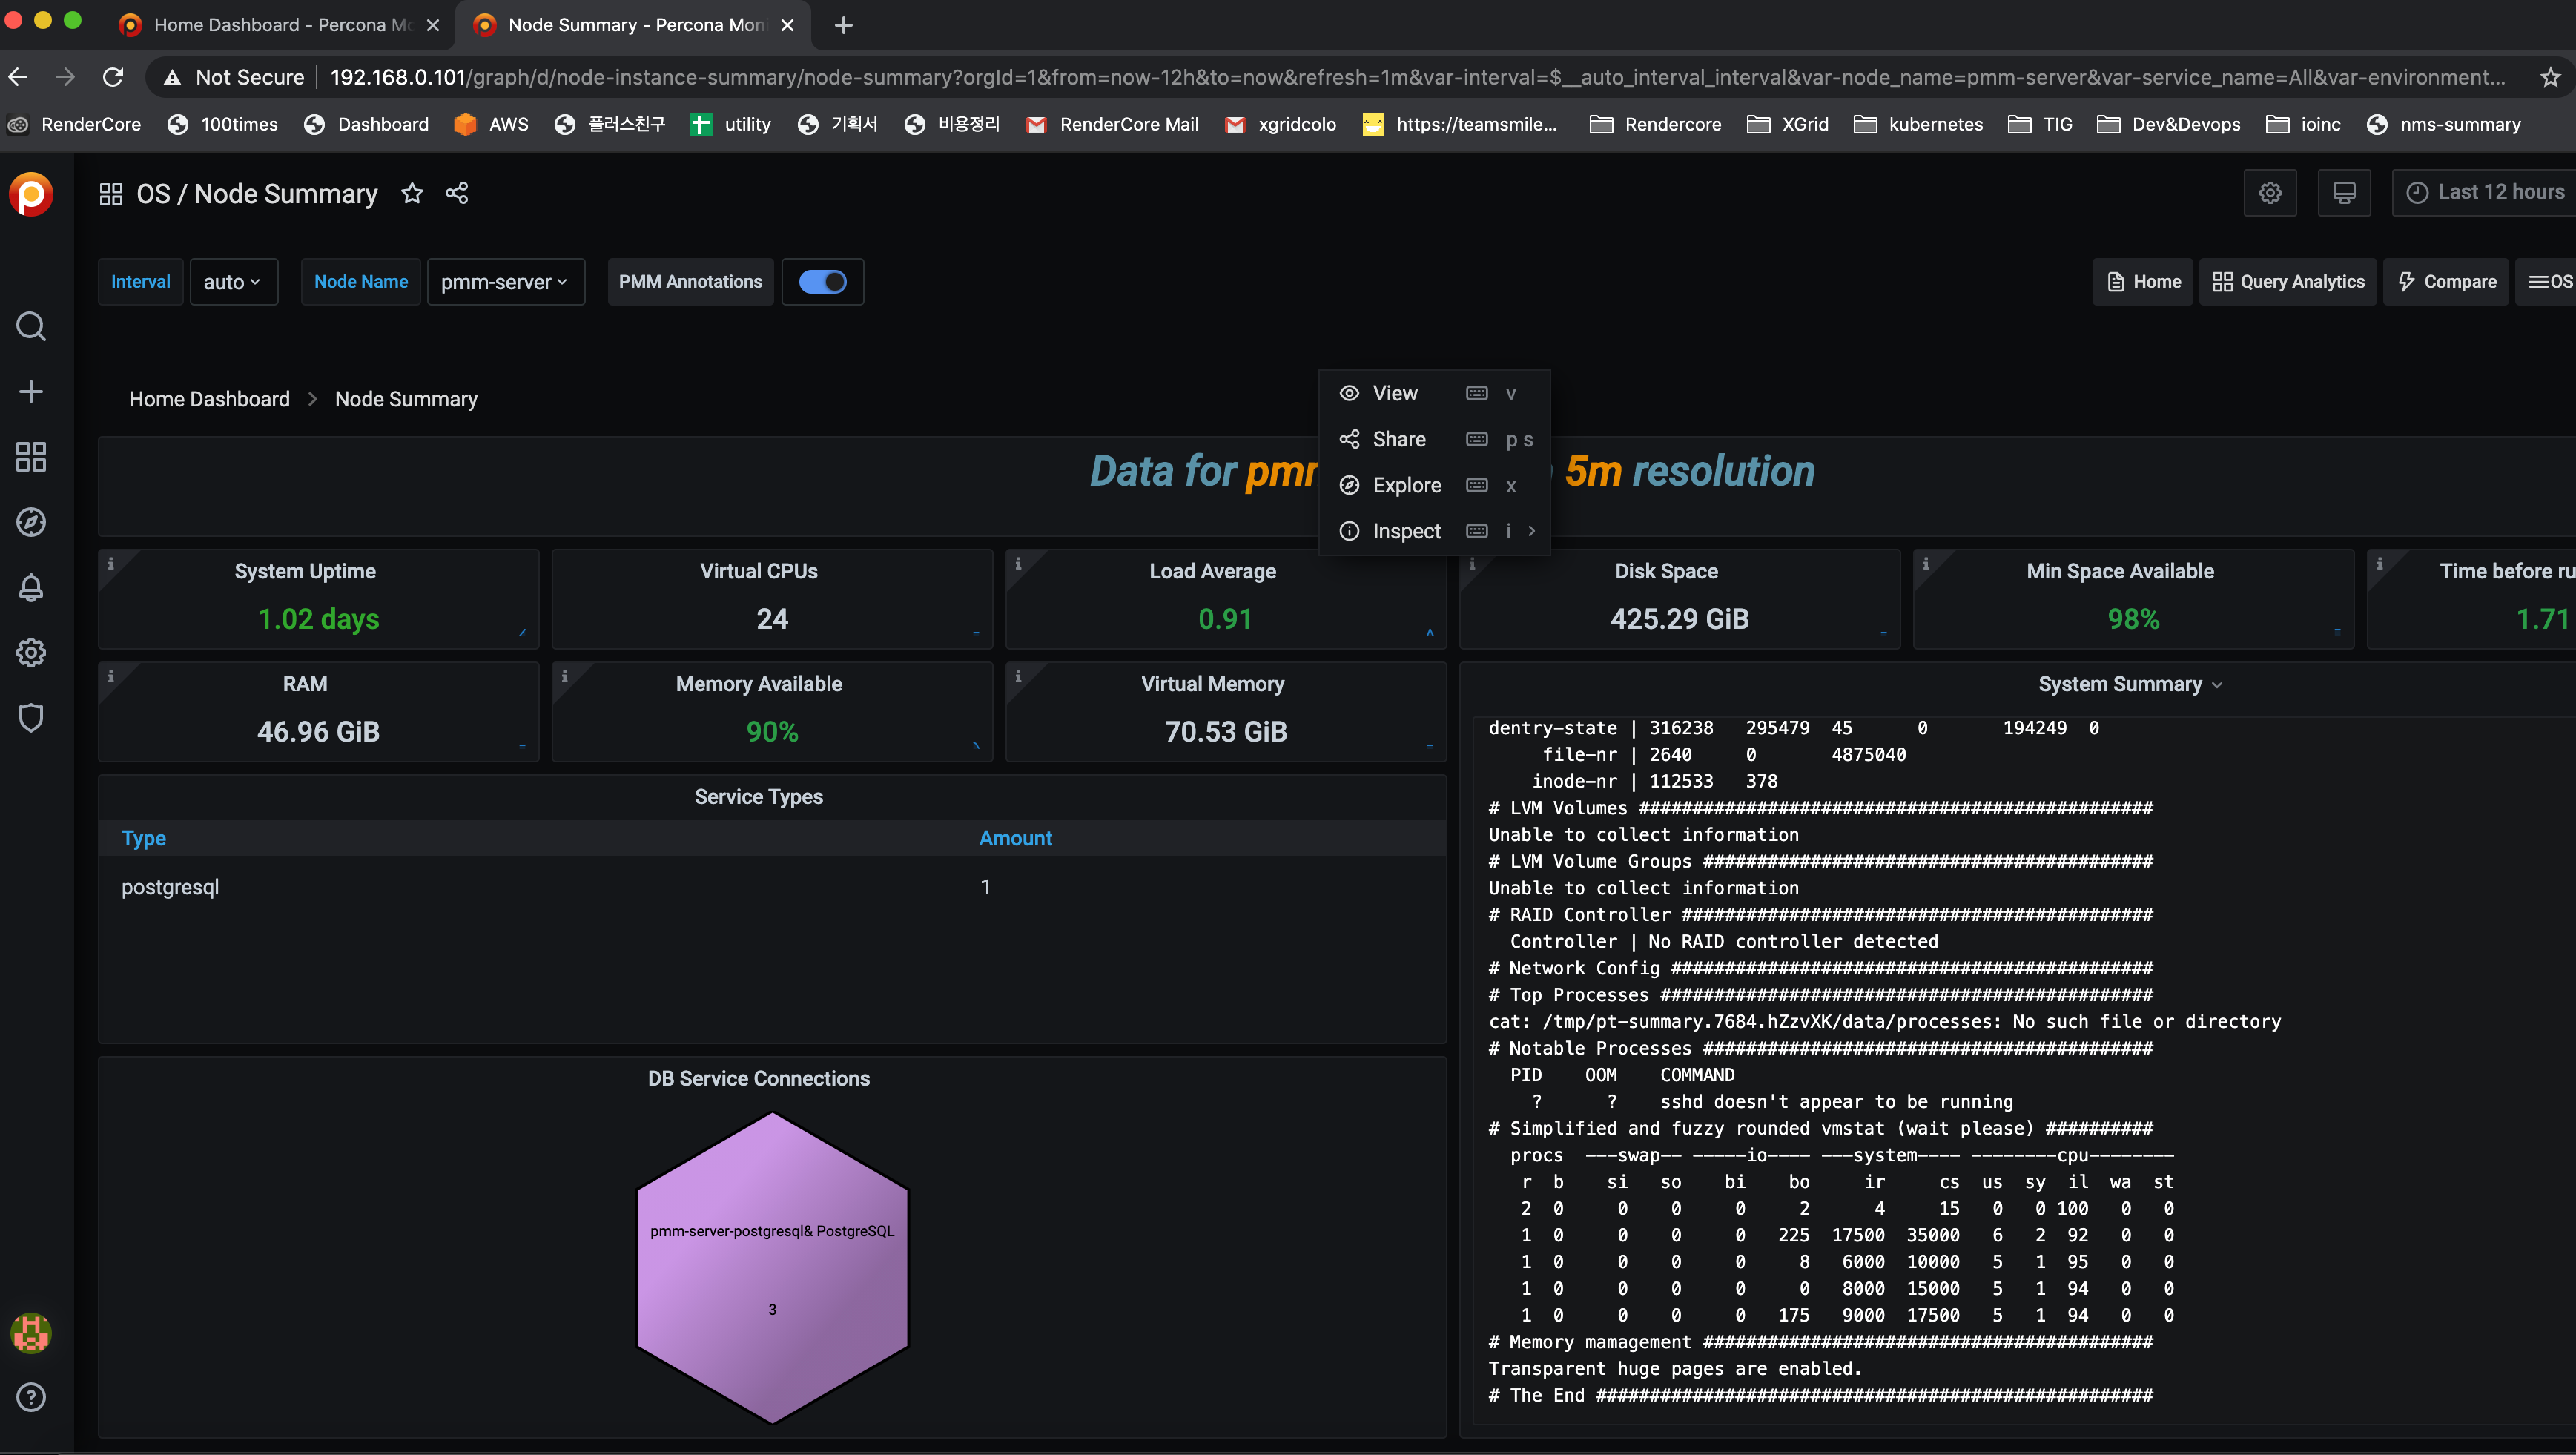
이같은 화면을 볼수 있다 뿐만아니라 잘만 사용하면 엄청나게 많은 정보를 얻을수 있다.
서버 클라이언트 구조로 되잇고 서버를 설치후 클라이언트는 각 pxc 노드에 설치해주면된다.
server
docker pull percona/pmm-server:2

# persistent data container
docker create --volume /srv \
--name pmm-data percona/pmm-server:2 /bin/true

docker run --detach --restart always \
--publish 80:80 --publish 443:443 \
--volumes-from pmm-data --name pmm-server \
percona/pmm-server:2
http://192.168.0.20 확인
admin/admin ==> 비번 변경 해서 사용한다.
client
각 노드에서 실행해준다.
설치
sudo yum install https://repo.percona.com/yum/percona-release-latest.noarch.rpm

sudo percona-release disable all
sudo percona-release enable original release

yum install pmm2-client -y
구성
- 등록
pmm-admin config --server-insecure-tls --server-url=https://admin:PASSWORD@192.168.0.20:443
# pmm-admin config --server-insecure-tls --server-url=https://admin:PASSWORD@192.168.0.20:443 --force # 기존 내용을 고치려면
node 상태가 보고가 되기 시작한다.
Adding MySQL Service Monitoring
pmm-admin add mysql --query-source=slowlog --username=root --password=PASSWORD
mysql 데이터들이 분석되기 시작한다.
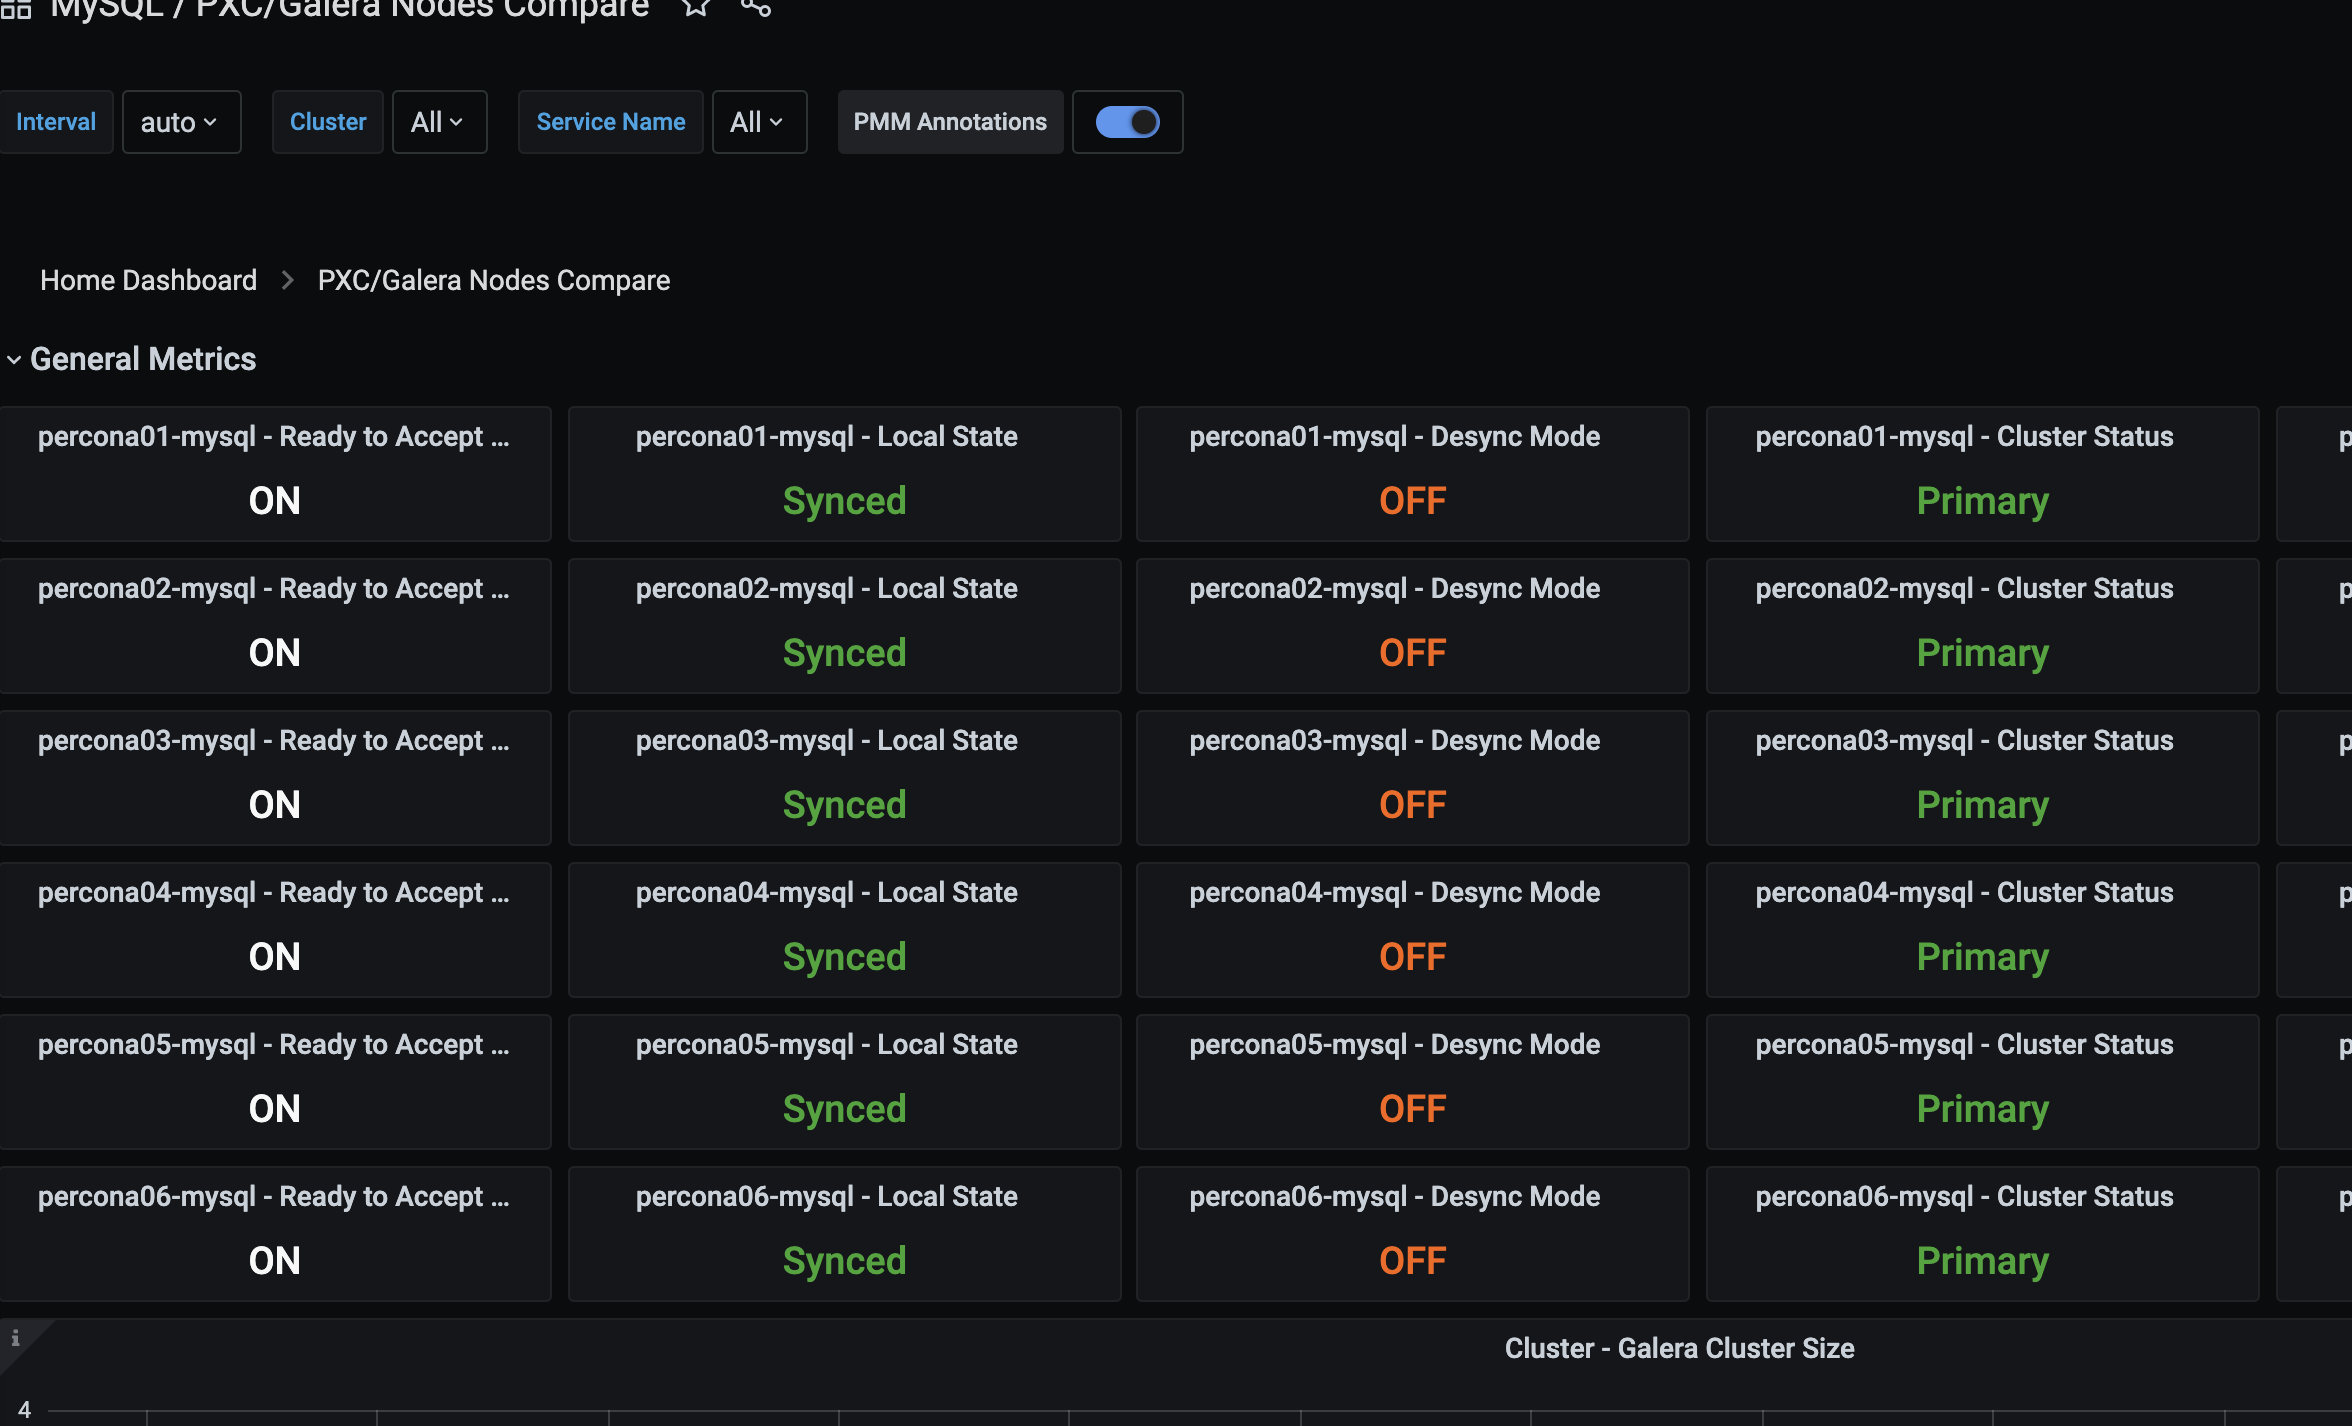
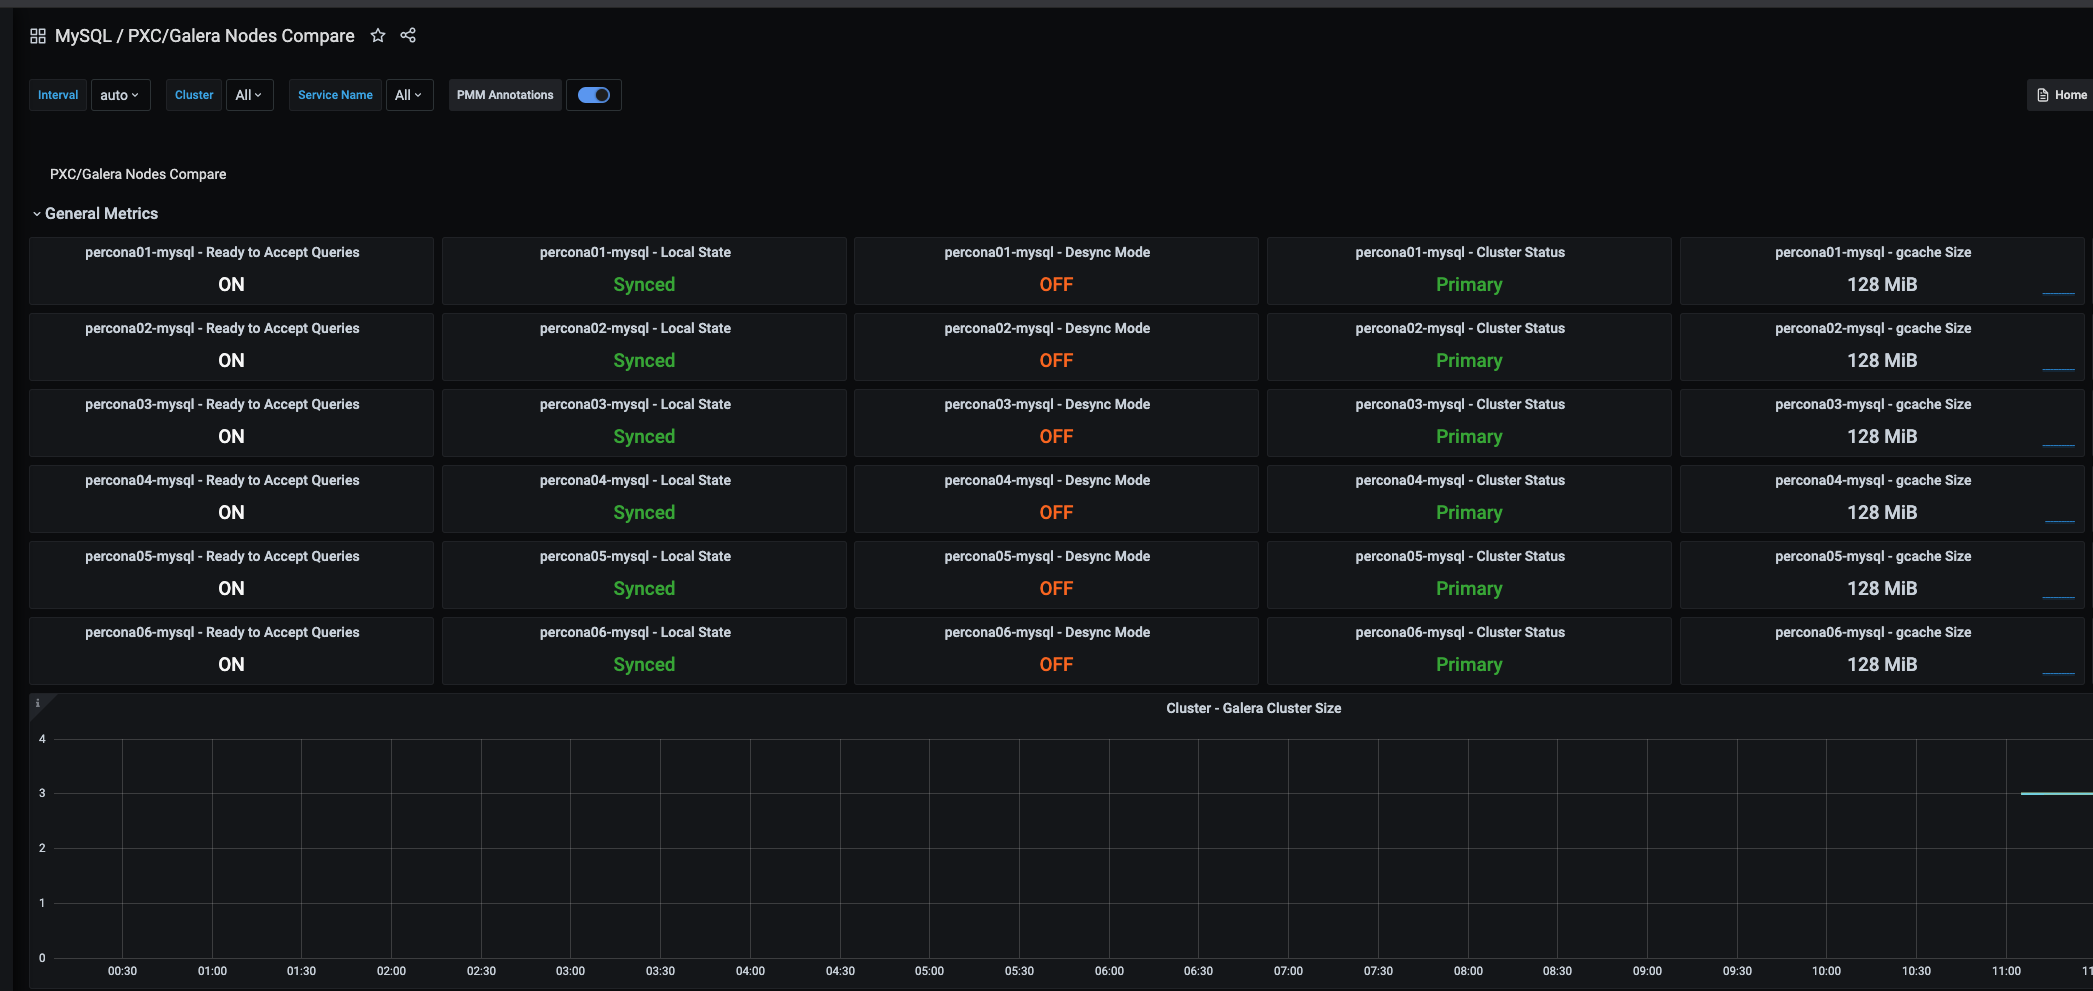
노드들 분석 보기
이부분을 누르고 검색에 pxc라고 누르면 관련 내용이 다 보인다.
http://192.168.0.20/graph/d/pxc-nodes-compare/pxc-galera-nodes-compare?orgId=1&refresh=1m
노드들이 한방에 보임
alert
이제 클러스터에 문제가 생기면 슬랙으로 알람을 받아보자.
pmm은 내부적으로 prometheus를 사용한다. 여기에서 특정 조건이 되면 alert manager로 데이터를 보내야 한다. 그럼 alert manager가 받아서 그걸 슬랙으로 보내준다.
일단 alert manager가 있어야겟다. 그리고 slack web hook가 있어야한다.
slack web hook를 만들기
이건 각자 찾아보기 바란다.
https://hooks.slack.com/services/AAAA/BBB/CCC
alert-manager를 설치하고 테스트
mkdir -p /data/git/docker/alertmanager/config
cd /data/git/docker/alertmanager
vi docker-compose.yml
version: "3.1"

services:
  alertmanager:
    image: prom/alertmanager
    ports:
      - 9093:9093
    volumes:
      - ./config/:/etc/alertmanager/
    restart: always
    command:
      - "--config.file=/etc/alertmanager/alertmanager.yml"
      - "--storage.path=/alertmanager"
vi config/alertmanager.yml
global:
  resolve_timeout: 5m
  slack_api_url: "https://hooks.slack.com/services/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"

receivers:
  - name: "slack-notifications"
    slack_configs:
      - channel: "#notify-pmm"

route:
  receiver: "slack-notifications"
docker compose up -d
이제 샘플 알림을 보내보자.
docker exec -it alertmanager_alertmanager_1 amtool alert add –alertmanager.url=http://127.0.0.1:9093 test
알람이 슬랙에 오면 된다.

pmm에서 메세지를 보내보자.
http://192.168.0.20/graph/d/pmm-settings/pmm-settings?orgId=1&from=now-12h&to=now
url : http://192.168.0.20:9093
groups:
  - name: MysqlClusterStatus
    rules:
      - alert: MysqlClusterStatus
        expr: mysql_global_status_wsrep_cluster_size < 4 #3
        annotations:
          description: "wsrep_cluster_size should be 3"
          summary: One Of Node replication Error
저장하고 나면 알림이 온다.
일부러 4로 해서 에러를 만들어보앗으나 실제는 3으로해서 현재 3개보다 적으면 알림이 오게 해야한다.
알림이 오니 추가 알림을 설정해보자.
https://github.com/prometheus/mysqld_exporter/blob/master/example.rules
기존 설정을 지우고 아래 설정으로 대체
groups:
  - name: NodeStatus
    rules:
      - alert: PXC Node Missing
        expr: up == 0
        for: 1m
        labels:
          severity: critical
        annotations:
          summary: "PXC Node missing (instance )"
          description: "A PXC Node target has disappeared. An exporter might be crashed.\n  VALUE = \n  LABELS: "
  - name: GaleraAlerts
    rules:
      - alert: MySQLGaleraNotReady
        expr: mysql_global_status_wsrep_ready != 1
        for: 5m
        labels:
          severity: warning
        annotations:
          description: " on  is not ready."
          summary: Galera cluster node not ready
      - alert: MySQLGaleraOutOfSync
        expr: (mysql_global_status_wsrep_local_state != 4 and mysql_global_variables_wsrep_desync == 0)
        for: 5m
        labels:
          severity: warning
        annotations:
          description: " on  is not in sync ( != 4)."
          summary: Galera cluster node out of sync
      - alert: MySQLGaleraDonorFallingBehind
        expr: (mysql_global_status_wsrep_local_state == 2 and mysql_global_status_wsrep_local_recv_queue > 100)
        for: 5m
        labels:
          severity: warning
        annotations:
          description: " on  is a donor (hotbackup) and is falling behind (queue size )."
          summary: xtradb cluster donor node falling behind
      - alert: MySQLReplicationNotRunning
        expr: mysql_slave_status_slave_io_running == 0 or mysql_slave_status_slave_sql_running == 0
        for: 2m
        labels:
          severity: critical
        annotations:
          description: Slave replication (IO or SQL) has been down for more than 2 minutes.
          summary: Slave replication is not running
      - alert: MySQLReplicationLag
        expr: (mysql_slave_lag_seconds > 30) and on(instance) (predict_linear(mysql_slave_lag_seconds[5m],60 * 2) > 0)
        for: 1m
        labels:
          severity: critical
        annotations:
          description: The mysql slave replication has fallen behind and is not recovering
          summary: MySQL slave replication is lagging
      - alert: MySQLReplicationLag
        expr: (mysql_heartbeat_lag_seconds > 30) and on(instance) (predict_linear(mysql_heartbeat_lag_seconds[5m],60 * 2) > 0)
        for: 1m
        labels:
          severity: critical
        annotations:
          description: The mysql slave replication has fallen behind and is not recovering
          summary: MySQL slave replication is lagging
      - alert: MySQLInnoDBLogWaits
        expr: rate(mysql_global_status_innodb_log_waits[15m]) > 10
        labels:
          severity: warning
        annotations:
          description: The innodb logs are waiting for disk at a rate of  / second
          summary: MySQL innodb log writes stalling
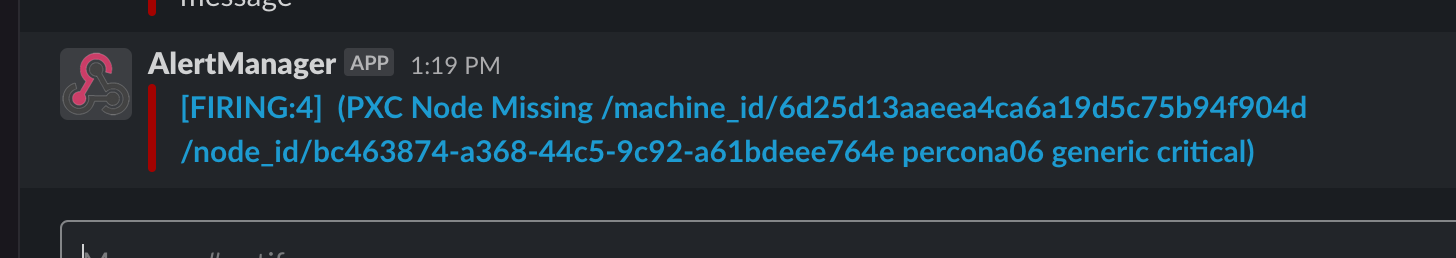
노드 하나를 재시작해서 알림이 슬랙으로 오나 보자.
expr: up == 0
for: 1m
기본이 체크가 10초니까 6번까지 에러가 나면 알림을 해라 이것이다. up은 0 이면 노드가 꺼진것이다.
샘플 alert rule
https://awesome-prometheus-alerts.grep.to/rules
여기 참고
기타 url
consule API : http://192.168.0.20/v1
sonsule webui : http://192.168.0.20/consul
grafana : http://192.168.0.20/graph
orchestrator : http://192.168.0.20/orchestrator
qan app : http://192.168.0.20/qan
prometheus : http://192.168.0.20/prometheus
alert manager : http://192.168.0.20:9093