서버나 프로그램을 모니터링 하기 위해 사용한다.
특징은 pull방식이라는것. 이것이 신의 한수 : Prometheus 서버가 노드나 프로그램등에 데이터를 요청하면 노드나 프로그램등은 데이터를 보내주면 된다. 노드나 프로그램등에서 전혀 리모트 서버에 대해 알 필요가없고 데이터의 전달에 대해서 고민하지 않아도 된다.
- push : 각각 모니터되는 서버에서 주기적으로 모니터링 서버로 데이터를 보내는 방식
- pull : 각각 모니터되는 서버에서 데몬만 돌고있고 모니터링 서버에서 request를 던저서 pull하는 방식
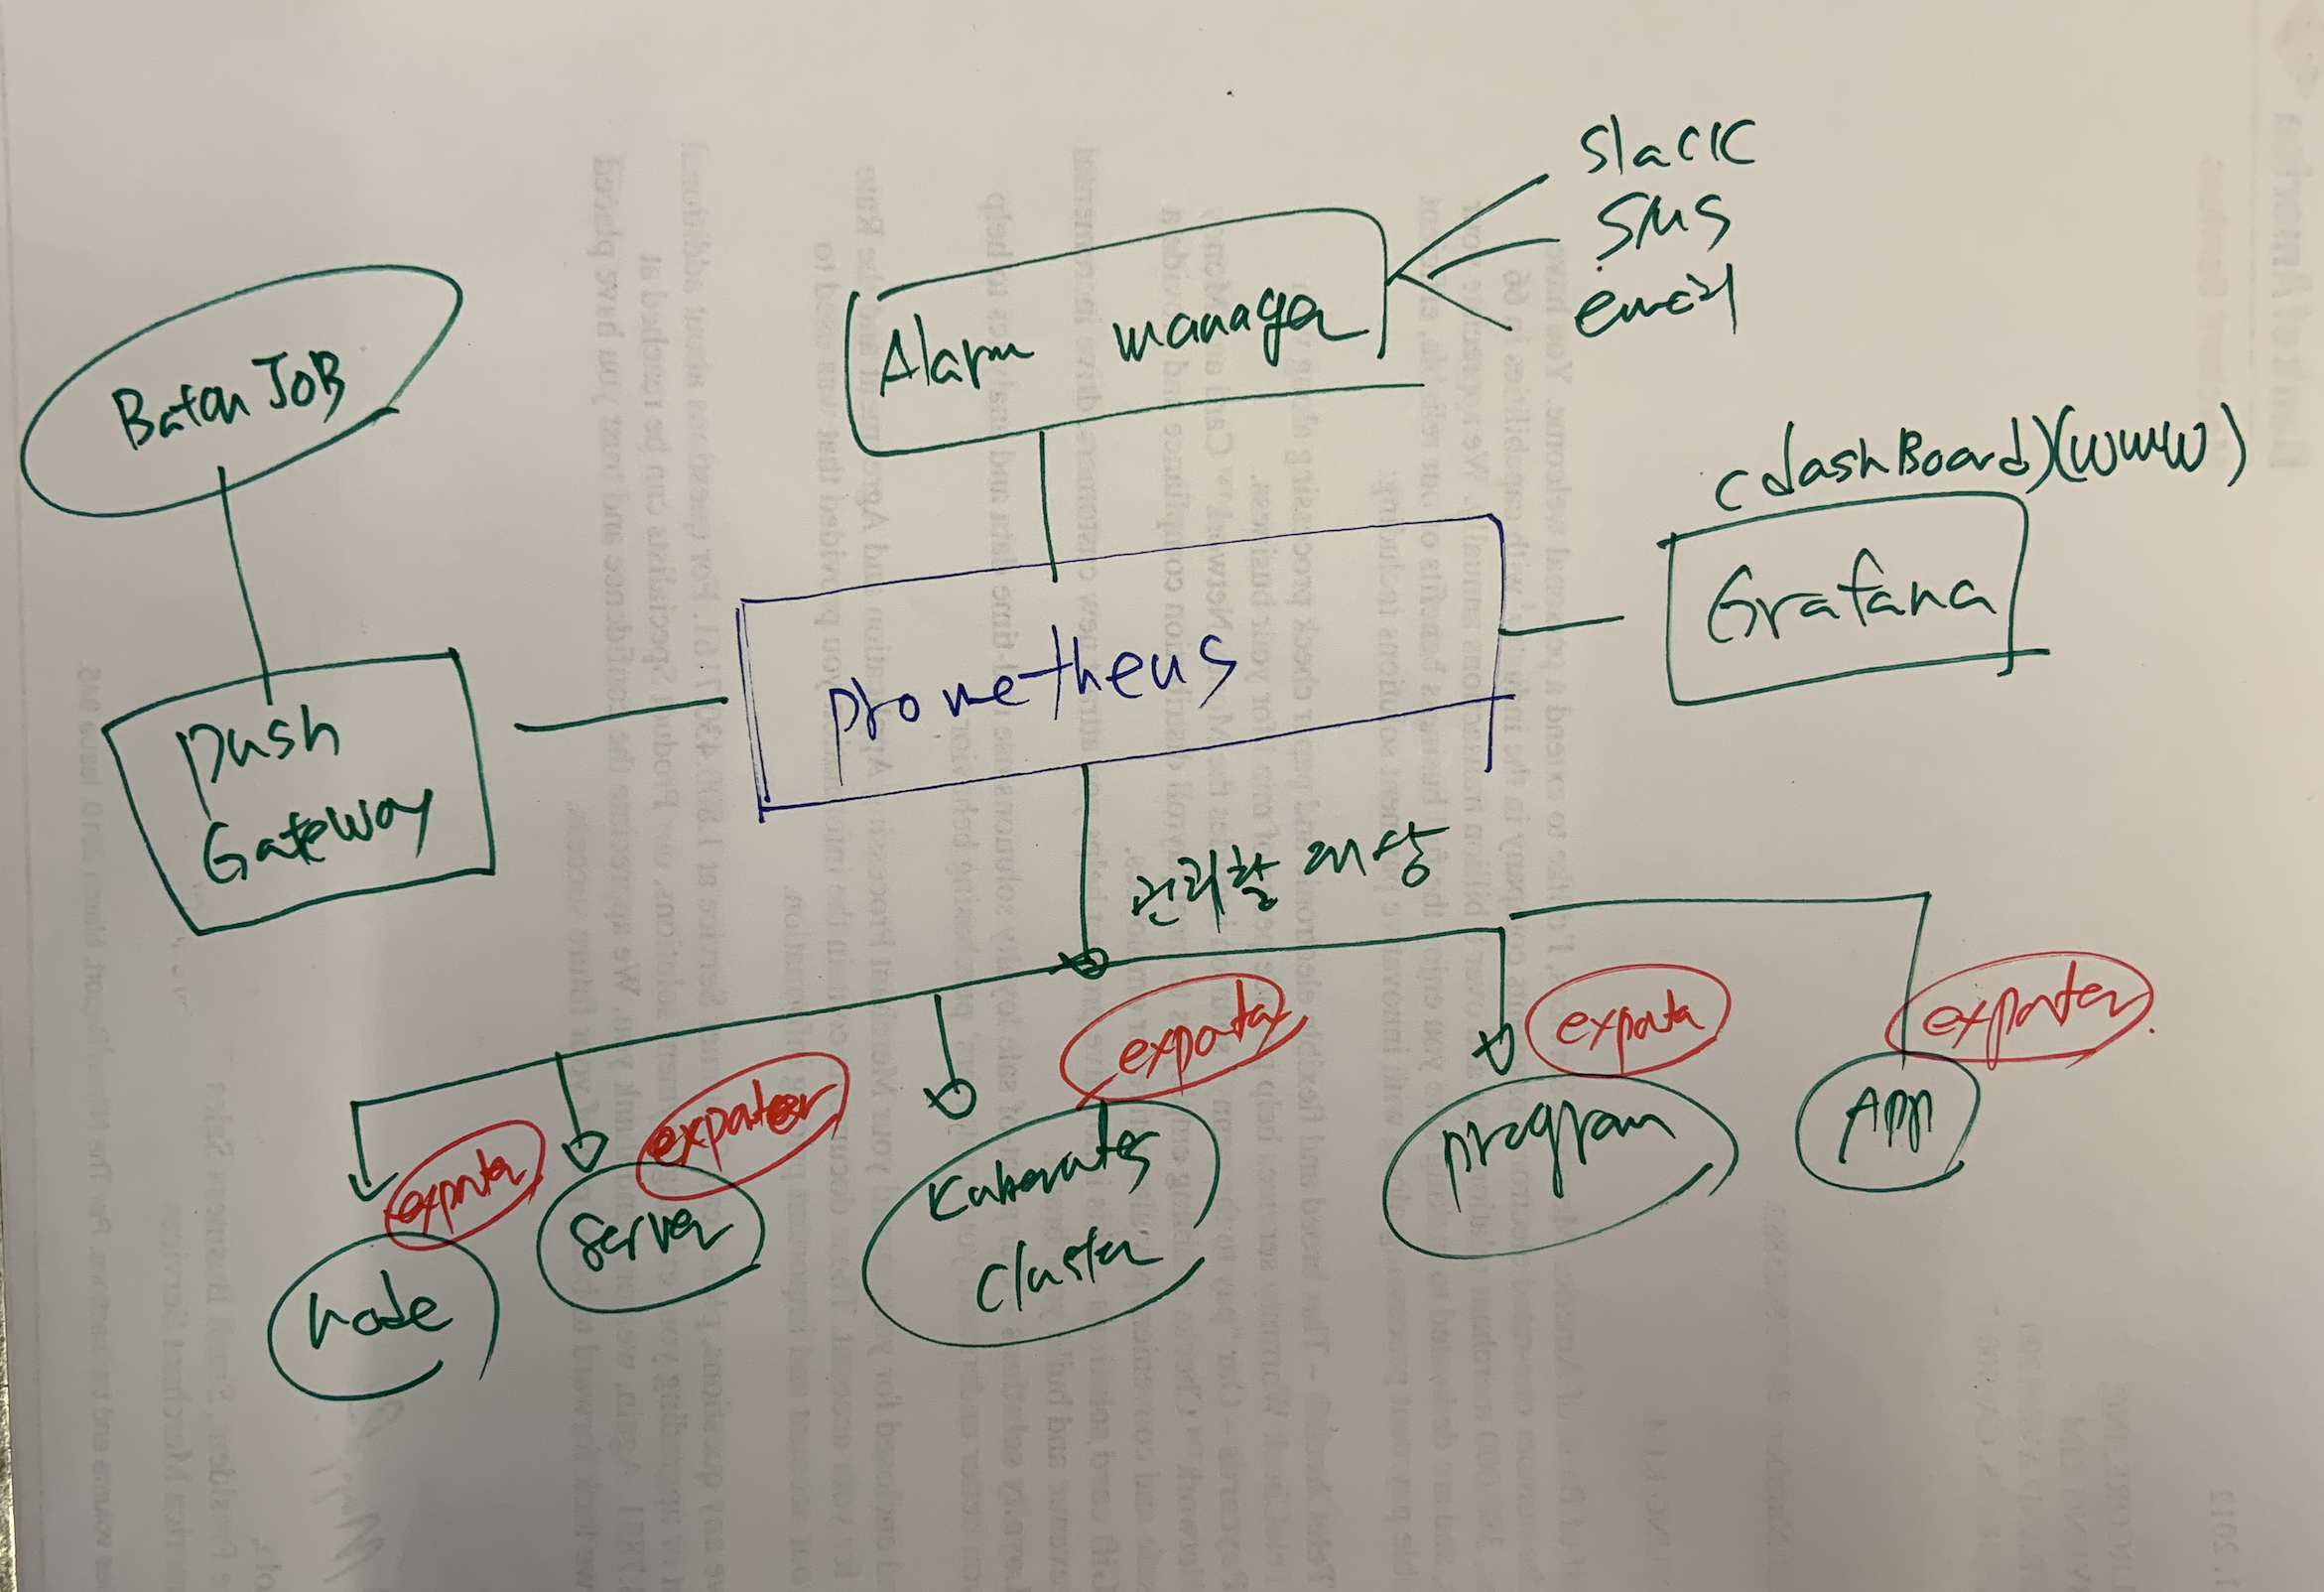
구성
- prometheus : 데이터를 요청하고 가져온 데이터를 저장하고 쿼리함
- exporter: 요청을 받으면 데이터를 만들어서 요청자에게 리턴해 준다.
- push gateway : 데몬형태로 프로그램이 떠있는게 아니고 배치형태로 실행되고 사라지는 프로세스는 pull을 할수가 없으므로 이걸 이용해서 prometheus에 보내준다.
- alarm manager : 데이터가 특정 조건이 되면 알림을 알려준다. (슬랙 또는 이메일 등등 많다.)
- dashboard : 웹화면으로 데이터를 보여준다. 기본적인 화면이 prometheus가 가지고 있으니 Grafana를 대부분 사용한다.
설치 방식
설치에는 다음 방식이 있다.
- 서버에 직접 설치
- binary로 설치
- docker를 설치
- kubernetes cluster에 설치
직접 서버 구성
vi /etc/hosts prometheus 192.168.0.100 node01 192.168.0.101
서버에 직접 설치하고 docker를 사용해서 설치한다.
https://prometheus.io/docs/prometheus/latest/installation/#using-docker
위 매뉴얼대로 해보자.
ssh prometheus
cd /data/git/docker/prometheus/
vi prometheus.yml
https://github.com/prometheus/prometheus/blob/master/documentation/examples/prometheus.yml
global:
  scrape_interval: 15s # Set the scrape interval to every 15 seconds. Default is every 1 minute.
scrape_configs:
  - job_name: 'prometheus'
    static_configs:
      - targets: ['prometheus:9090']
prometheus.yml을 설정하고 나서 도커를 실행하자.
docker run \
  -p 9090:9090 \
  -v /data/git/docker/prometheus/prometheus.yml:/etc/prometheus/prometheus.yml \
  prom/prometheus
서비스가 실행되면 로컬에서 확인해보자
이제 웹브라우저를 통해 http://prometheus:9090 을 확인해보면 알수 있다.
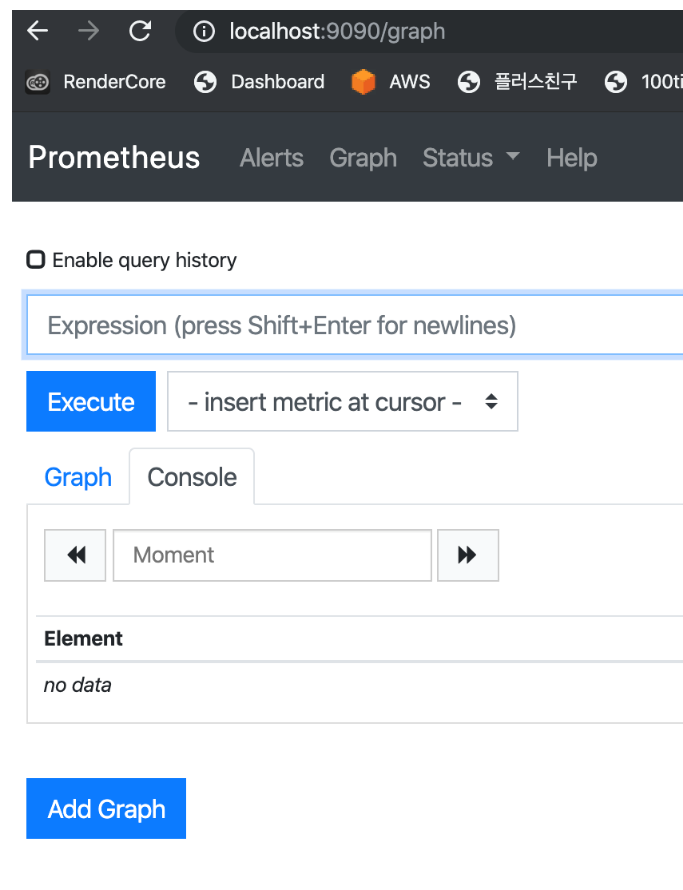
이제 확인해보자.
다음그림처럼 up을 넣고 엔터를 처보면
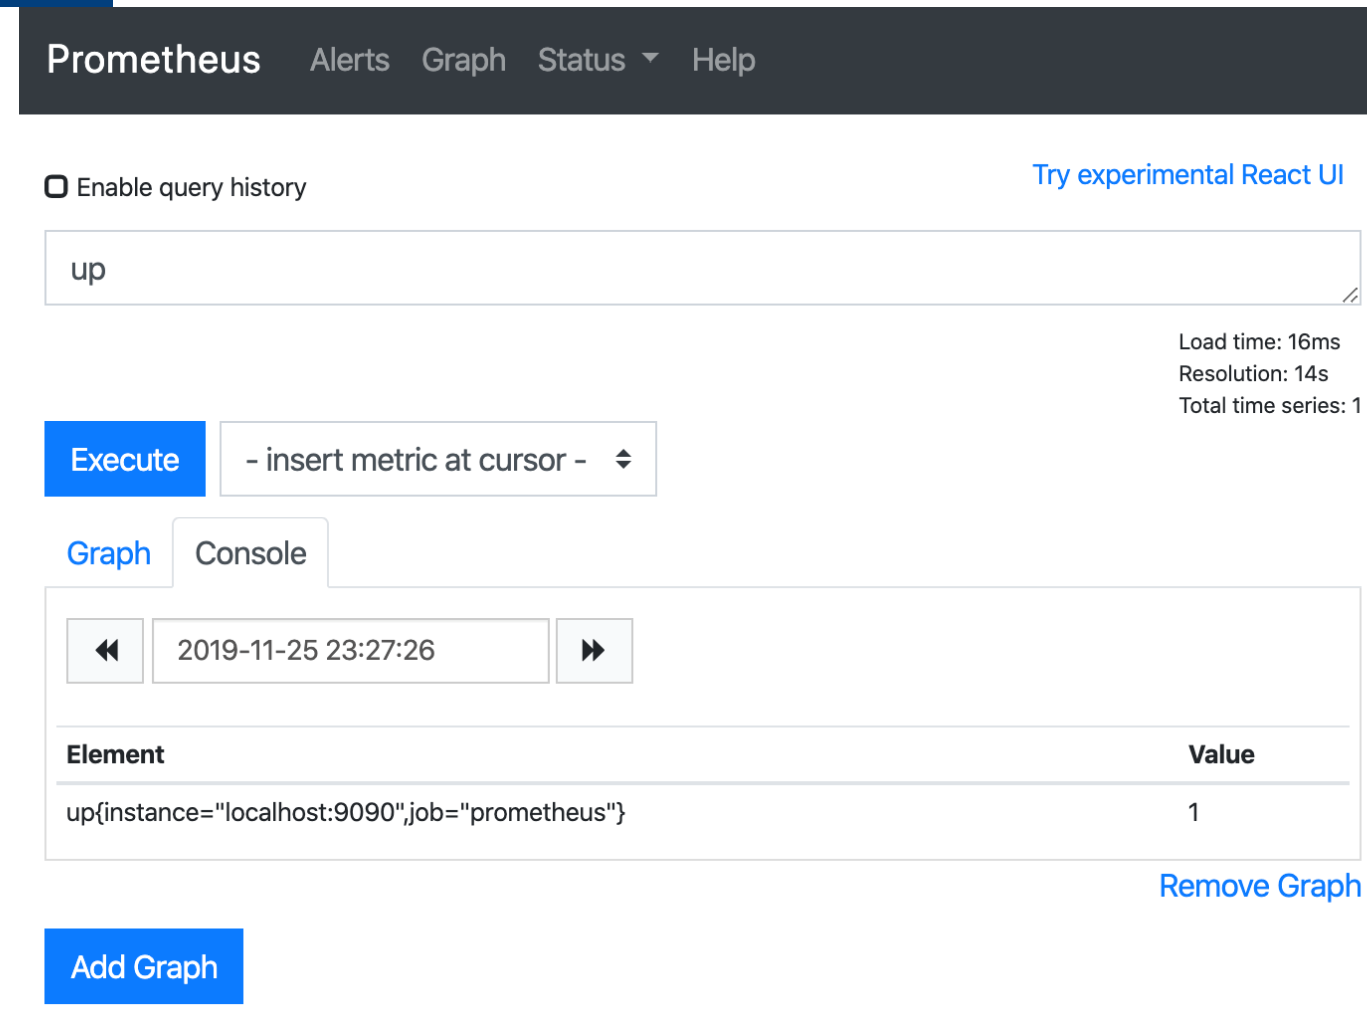
up은 Prometheus가 추가하는 특별한 형태의 메트릭이다. 1은 성공이라는 의미이다.
모니터링 하기
Node Exporter 설치 (리눅스 서버 모니터링)
이제 모니터링 할 서버를 설정하자. Prometheus가 요청하면 데이터를 만들어서 준다. .
Node Exporter는 cpu 메모리 디스크공간 디스크 i/o 네트워크 대역폭 같은 모든 표준 메트릭을 제공한다.
노드 exporter는 바이너리로 설치
https://prometheus.io/download
wget https://github.com/prometheus/node_exporter/releases/download/v0.18.1/node_exporter-0.18.1.linux-amd64.tar.gz

tar -xvzf node_exporter-0.18.1.linux-amd64.tar.gz

cd node_exporter-0.18.1.linux-amd64/

mv node_exporter /usr/local/bin/
vi /etc/systemd/system/node_exporter.service
[Unit]
Description=Node Exporter
After=network.target

[Service]
User=root
Group=root
Type=simple
ExecStart=/usr/local/bin/node_exporter

[Install]
WantedBy=multi-user.target
systemctl daemon-reload

systemctl start node_exporter

systemctl enable node_exporter
모니터링 당하는 서버에 메트릭을 가져와보자.
http://192.168.0.101:9100/metrics
결과가 쭉 나온다 node exporter는 동작한다. 이제 프로메테우스가 주기적으로 이걸 가져오면된다.
Prometheus 설정에 추가하자.
vi /data/git/docker/prometheus/prometheus.yml
scrape_configs:
  - job_name: 'prometheus'
    static_configs:
      - targets: ['prometheus:9090']

  - job_name: 'node_exporter'
    static_configs:
      - targets: ['192.168.0.101:9100']
      # - targets: ['192.168.0.101:9100','192.168.0.102:9100'] #여러대면 이렇게 추가하면된다.
docker ps -a
docker stop xxx
docker rm xxxx

docker run \
  -p 9090:9090 \
  -v /data/git/docker/prometheus/prometheus.yml:/etc/prometheus/prometheus.yml \
  prom/prometheus
Prometheus 타겟에 추가가 된건지 확인하자.
http://prometheus:9090/targets
node01에서 재부팅해보자 서비스만 꺼도 됨.
ssh node01
systemctl stop node_exporter
systemctl status node_exporter
systemctl start node_exporter
systemctl status node_exporter
이제 http://prometheus:9090/graph 에서 up을 확인해보자 내려갔다가 올라온것을 확인할수 있다.
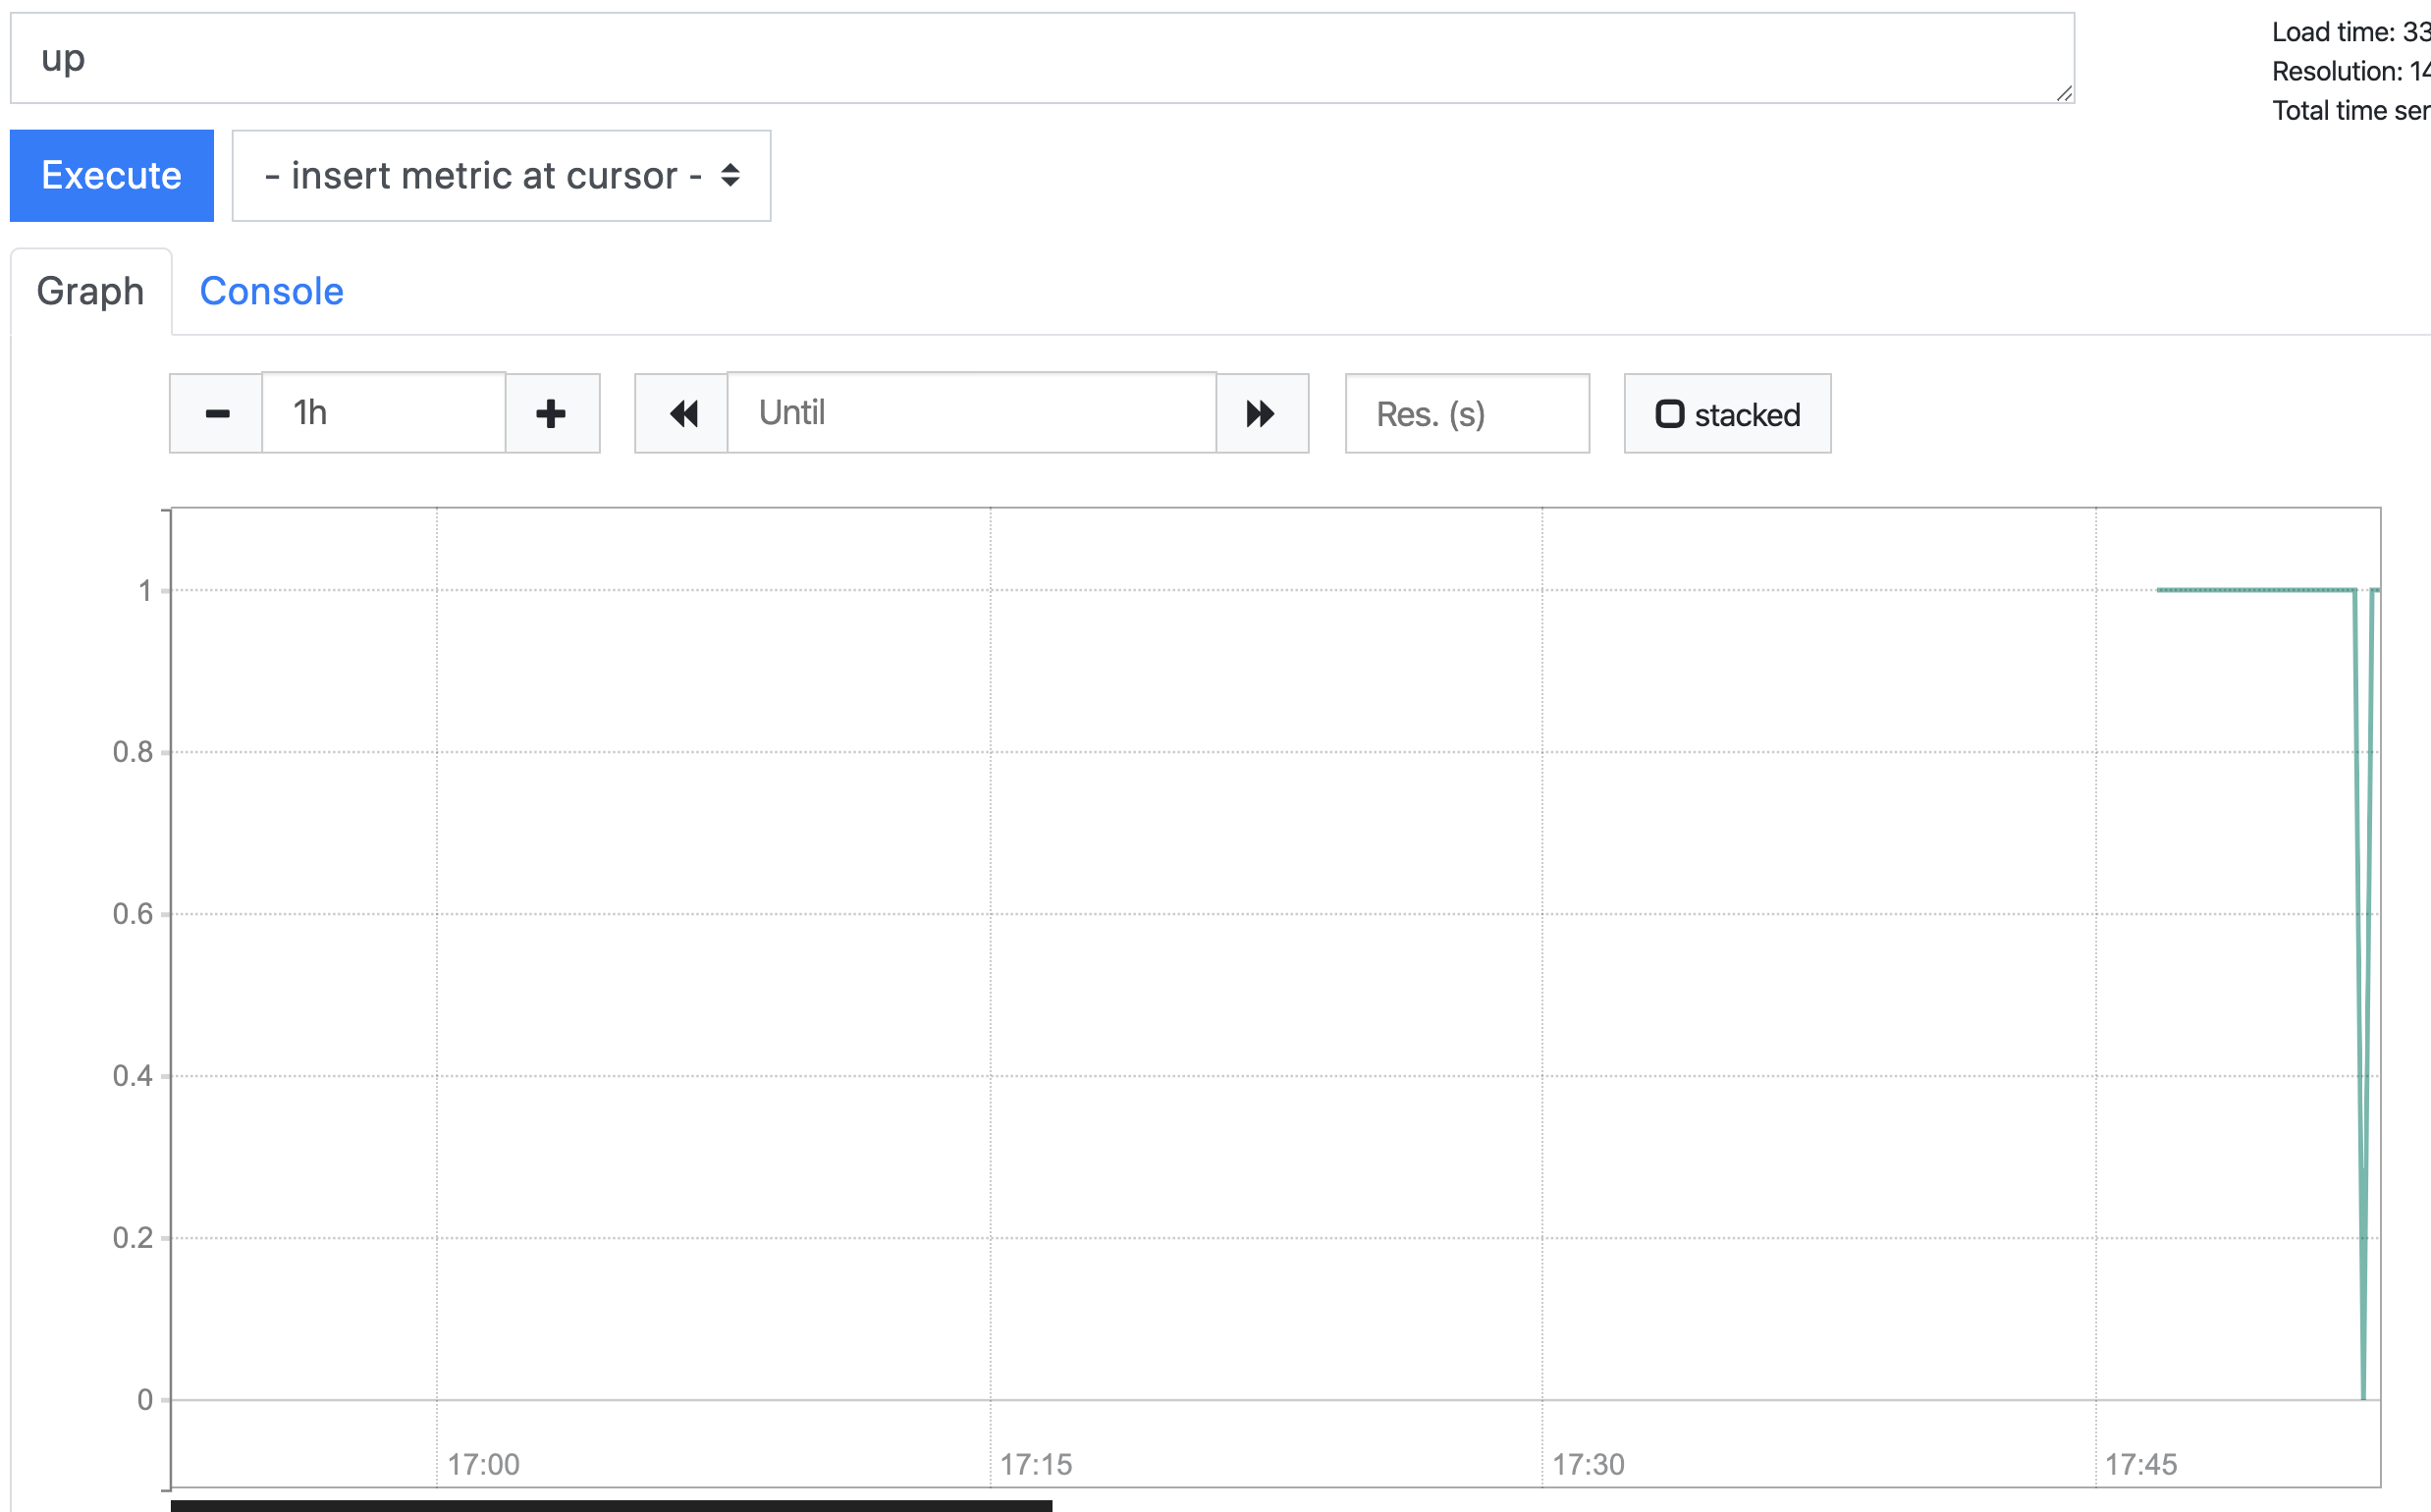
Prometheus 잘 동작하고 node exporter도 잘 동작하는것을 알수가 있다.
이제 docker-compose로 만들어서보자.
version: '3.7'
services:
  prometheus:
    image: prom/prometheus
    volumes:
      - ./prometheus.yml:/etc/prometheus/prometheus.yml
      - prometheus_data:/prometheus
    ports:
      - 9090:9090
    restart: always

volumes:
  prometheus_data: {}
docker-compose up -d
Grafana
프로메테우스도 그래프를 그리는 기능은 있으나 그라파나가 요즘 표준이다. 프로메테우스의 값을 data source로 사용하여 그래프를 그리거나 dashboard를 만들어준다.
vi docker-compose.yml
  ...
  grafana:
    image: grafana/grafana
    depends_on:
      - prometheus
    ports:
      - 3000:3000
    volumes:
      - grafana_data:/var/lib/grafana
    restart: always

volumes:
  ...
  grafana_data: {}
docker-compose down
docker-compose up -d

docker ps # 이름을 알아둔다.
>cf7af21a3c73        grafana/grafana     "/run.sh"                4 minutes ago       Up 2 minutes        0.0.0.0:3000->3000/tcp   prometheus_grafana_1
>db16bad0f51e        prom/prometheus     "/bin/prometheus --c…"   4 minutes ago       Up 2 minutes        0.0.0.0:9090->9090/tcp   prometheus_prometheus_1
prometheus_grafana_1 에서 prometheus_prometheus_1에 접속해서 데이터를 가져와서 화면에 보여준다.
web으로 확인
admin/admin
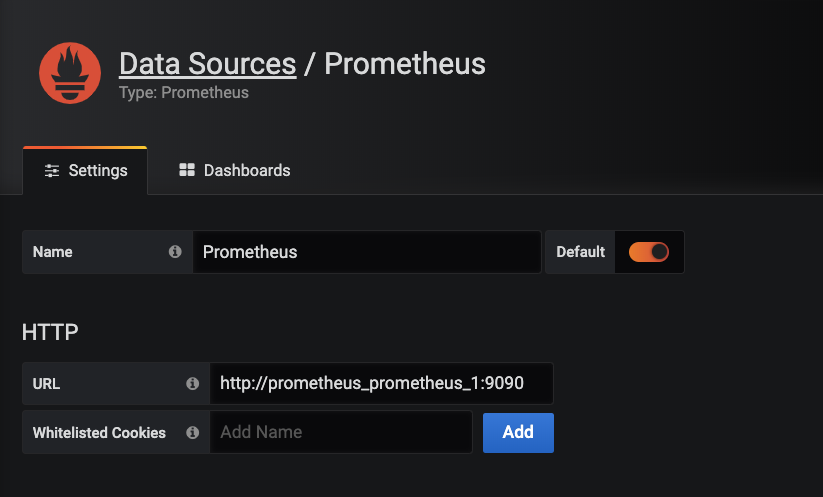
add datasource
url : http://prometheus_prometheus_1:9090
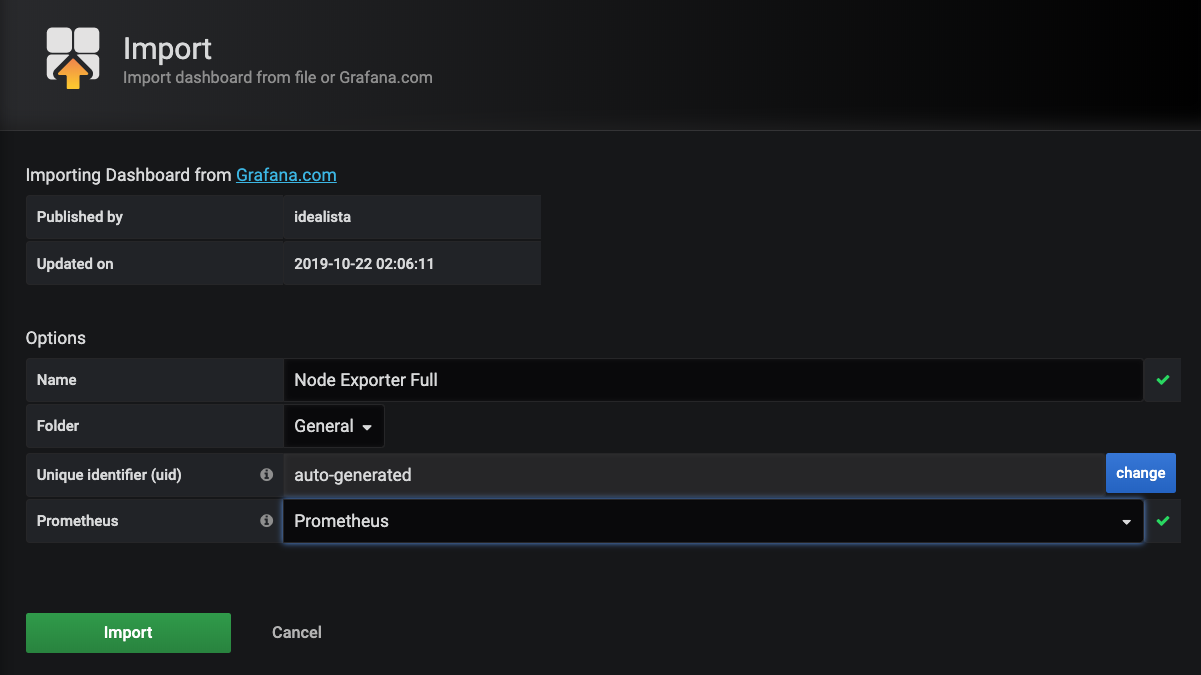
- create dashboard for node exporter
create dashboard (+ 메뉴 )> import 1860 > prometheus > prometheus select > import click
https://grafana.com/grafana/dashboards/1860
여기까지 하면 기본 모니터링은 다 할수 있다
다음부터는 추가내용이다.
윈도우 node 모니터링
참고 https://medium.com/@facundofarias/setting-up-a-prometheus-exporter-on-windows-b3e45f1235a5
https://github.com/martinlindhe/wmi_exporter
https://grafana.com/grafana/dashboards/2129 theme
https://github.com/martinlindhe/wmi_exporter/releases 다운후 설치하면 서비스로 설치 완료

msi download후 노드에 설치
설치 노드에서 다음 확인
외부에서 다음 테스트
Prometheus에 추가하여 붙이자. 9182 포트를 쓴다.
vi prometheus.yml
global:
  scrape_interval: 15s
scrape_configs:
---
- job_name: 'win_node_exporter'
  static_configs:
    - targets: ['10.1.5.40:9182', '10.1.5.57:9182']
이렇게 하면 윈도우도 모니터링이 된다.
`
알림
node export node01을꺼보자.
ssh node01 systemctl stop node_exporter
http://prometheus:9090/targets 에서 체크해보면 꺼진것을 알수 있다.
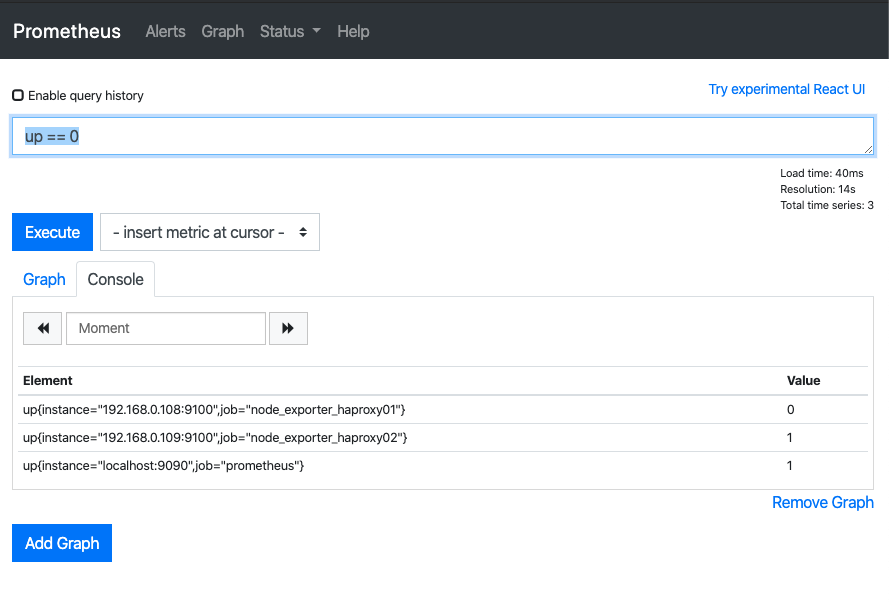
그래프에서 up == 0 을 넣어서 꺼진것만 확인해보자.
1개만 나온다.
이제 다 된듯
알림 규칙 추가
vi /data/git/docker/prometheus/prometheus.yml
global:
  ...
  evaluation_interval: 15s # Evaluate rules every 15 seconds. The default is every 1 minute.

rule_files:
  - "rules.yml"

# Alertmanager configuration
alerting:
  alertmanagers:
  - static_configs:
    - targets:
      - alertmanager:9093
vi rules.yml
groups:
  - name: example
    rules:
      - alert:InstanceDown
        expr: up == 0
        for: 1m
docker run -d -p 9090:9090 -v /data/git/docker/prometheus/prometheus.yml:/etc/prometheus/prometheus.yml -v /data/git/docker/prometheus/rules.yml:/etc/prometheus/rules.yml --name prom prom/prometheus
http://prometheus:9090/alerts
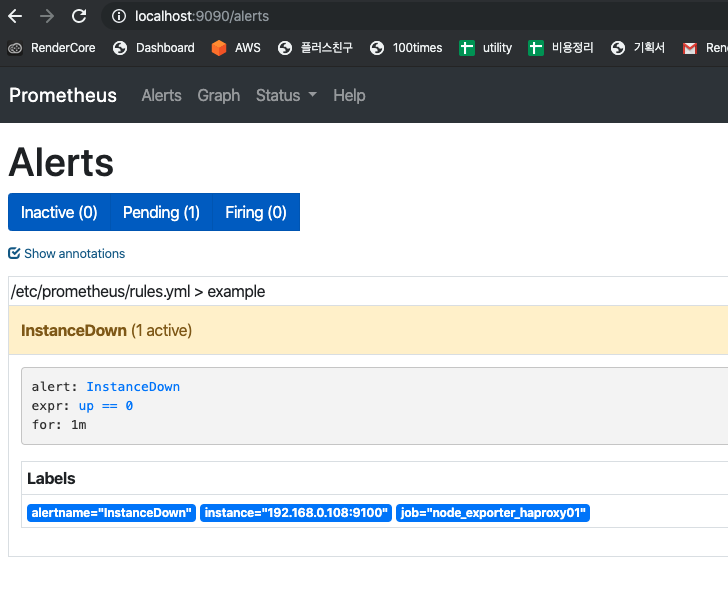
이제 알림이 확보가 됬다.
알람 매니저 설치
바이너리와 도커로 올리는 방식 2가지가 있다. 도커를 사용한다.
ssh prometheus
https://github.com/prometheus/alertmanager/blob/master/doc/examples/simple.yml 참고
vi alertmanager.yml
global:
  smtp_smarthost: 'localhost:25'
  smtp_from: 'alertmanager@example.org'
route:
  receiver: team-mails
receivers:
  - name: 'team-mails'
    email_configs:
      - to: 'teamsmiley@gmail.com'
docker run -p 9090:9090 -v /data/git/docker/prometheus/prometheus.yml:/etc/prometheus/prometheus.yml -v /data/git/docker/prometheus/rules.yml:/etc/prometheus/rules.yml -v /data/git/docker/prometheus/alertmanager.yml:/etc/prometheus/alertmanager.yml prom/prometheus
./alertmanager를 실행하면 이메일을 받는다.
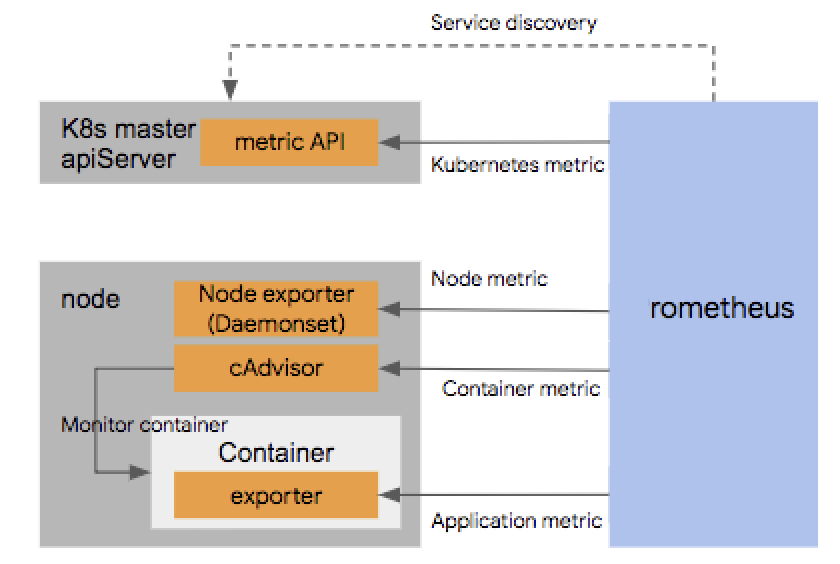
kubernetes 모니터링
외부 서버에서 쿠베 모니터링을 붙이는건 잘 안되서 포기햇고 쿠베 클러스터에 Prometheus를 띄워서 설치하는 샘플을 가져와서 성공
쿠버네티스 클러스터를 모니터링 하려고 한다. 다음처럼 나눌수 있다.
- 쿠버네티스 노드를 모니터링 하려는 경우
- node exporter를 수동으로 설치
- daemonset 을 이용해서 배포 - 한노드당 하나만 올라와서 적당.(추천)
- 쿠버네티스 자체 컴포넌트와 서비스등을 모니터하려는 경우
- 쿠버네티스에 올려둔 app의 모니터링
노드 자체를 모니터링 하려는 경우는 node exporter를 설치하면 된다 노드가 추가되면서 계속 설치해줘야 한다. 불편한경우에는 kubernetes 의 daemonset을 이용하면된다. daemonset은 노드에 하나씩만 올라간다.
- cAdvisor cpu memory 등을 docker수준에서 보여줌.
- Kube-state-metrics orchestration metadata: deployment, pod, replica status, etc.
- Metrics-server resource metrics API: CPU, file descriptors, memory, request latencies, etc.
위 내용들과 grafana 까지 한꺼번에 설치가능
kube-prometheus, prometheus operator
https://github.com/coreos/kube-prometheus#quickstart
kubernetes는 쿠버네티스에 Prometheus를 설치하고 그것이 모니터링 하는것으로 해야할듯.
kube-prometheus 라고 하는것이 가지고 있는 패키지
- The Prometheus Operator
- Highly available Prometheus
- Highly available Alertmanager
- Prometheus node-exporter
- Prometheus Adapter for Kubernetes Metrics APIs
- kube-state-metrics
- Grafana
시작
cd ~/Desktop
git clone https://github.com/coreos/kube-prometheus.git
cd ~/Desktop/kube-prometheus

# Create the namespace and CRDs, and then wait for them to be availble before creating the remaining resources
kubectl create -f manifests/setup
until kubectl get servicemonitors --all-namespaces ; do date; sleep 1; echo ""; done
kubectl create -f manifests/

## 삭제
kubectl delete --ignore-not-found=true -f manifests/ -f manifests/setup
dashboard
kubectl --namespace monitoring port-forward svc/prometheus-k8s 9090
http://localhost:9090
kubectl --namespace monitoring port-forward svc/grafana 3000
http://localhost:3000
구조
노드 익스포터 daemonset 으로 자동 설치가 됨
그라파나로 확인도 되고
그라파나 외부 오픈
vi ~/Desktop/kube-prometheus/manifests/grafana-service.yaml
apiVersion: v1
kind: Service
metadata:
  labels:
    app: grafana
  name: grafana
  namespace: monitoring
spec:
  ports:
    - name: http
      port: 3000
      targetPort: http
  type: LoadBalancer #여기 수정
  loadBalancerIP: 192.168.0.104 #여기 수정
  selector:
    app: grafana
ingress로 오픈하는게 더 나아보인다.